HIGH SALIENCE / RESEARCH / BUSINESS INTELLIGENCE TEARDOWN
TEARDOWN 12 · PUBLISHED SEPTEMBER 26, 2026 · DATASET INCLUDED
100 Questions, Twelfth Category: Business Intelligence, Where Power BI Is the Default Pick and the Vendor Google Ranks Most Is Chosen Only When Named
Twelfth category, same method: 100 business intelligence software queries, ChatGPT with web search on, every answer coded by two independent AI readers, Google's top ten as a control. Power BI is the default: named in 75 answers and picked as the answer's own choice in 69. Google's Looker family is second once Looker Studio is counted in, and Tableau is third. The gap from Google is the widest in the series so far. Domo's own site sits in Google's top ten for 43 of the 100 questions, more than any other vendor's, and ChatGPT picked Domo only when the question named it.
01Method
Same query structure, same coding, one new category.
Queries: 100 business intelligence software queries built from the same templates as the earlier teardowns: 30 category, 30 comparison, 20 alternative and 20 recommendation. The full list is in the dataset.
Surface: ChatGPT with web search forced on, logged out, United States, English, via the DataForSEO scraper, one run per query, collected September 26, 2026.
Control: Google's top ten organic results for the same queries in the same window, via the DataForSEO SERP API at depth 20 and truncated to the first ten organic results.
Coding: every answer was coded by two independent AI readers (Claude agents working blind from a written protocol), with a third settling disagreements. They were not people. Each brand named was coded picked (the answer's own verdict: "my pick", "choose X if", a shortlist it tells you to act on, the #1 of its ranking), recommended (assigned to a stated case or fit, such as "best for small teams", without being the answer's verdict), listed (named as an option, no fit given), passing (named but not offered as an option) or anchor (the brand being replaced in an "alternatives" query), against a 45-brand dictionary fixed after collection, before the final coding run (every change is listed in DICTIONARY_CHANGES.md), under codebook v2.0. "Recommended" in the tables includes picked brands. The two readers agreed on 98.5% of brand codes in this teardown (100.0% at the recommended level). Cited URLs were deduplicated to their domain and classed as first-party or third-party. The third reader decided 7 of the 454 brand codes in this teardown. A rules-based first pass (the codebook v1.6 rules) agreed with the final codes on 95.6 percent at the recommended level; only the reader codes are published. The readers also coded three brand mentions that no dictionary alias matched (named by meaning or only by a web address); those rows are in the dataset.
Collection note: the ChatGPT answers and the Google controls were collected on September 26, 2026 through the DataForSEO standard queue, between about 8:15 and 8:30 PM Mountain time (the raw files carry UTC timestamps, early September 27), with raw responses saved exactly as returned. No task failed and none was re-run. Looker and Looker Studio are counted as one brand, Looker, because every mention of "Looker Studio" also contains "Looker"; read Looker's numbers as Google's Looker family, and see the findings for how they split. After collection and before the final coding run, two brands were given a second web address: GoodData now also matches gooddata.ai, its current site, and Power BI also matches powerbi.com. That moved three citations from third-party to vendor and changed no mention counts. google.com counts as Looker's own site and microsoft.com as Power BI's. Microsoft Excel and Google Sheets are not in the dictionary. Six aliases that are also ordinary words (Superset, Preset, Sigma, Hex, Omni, Amplitude) match only when capitalized. The original dictionary and the list of changes ship with the dataset.
One run per query, so this is a teardown, not the benchmark. Frequencies describe this window only. Absence means not observed in this sample, never zero visibility.
02Findings
One default, a split second place, and the widest gap from Google so far.
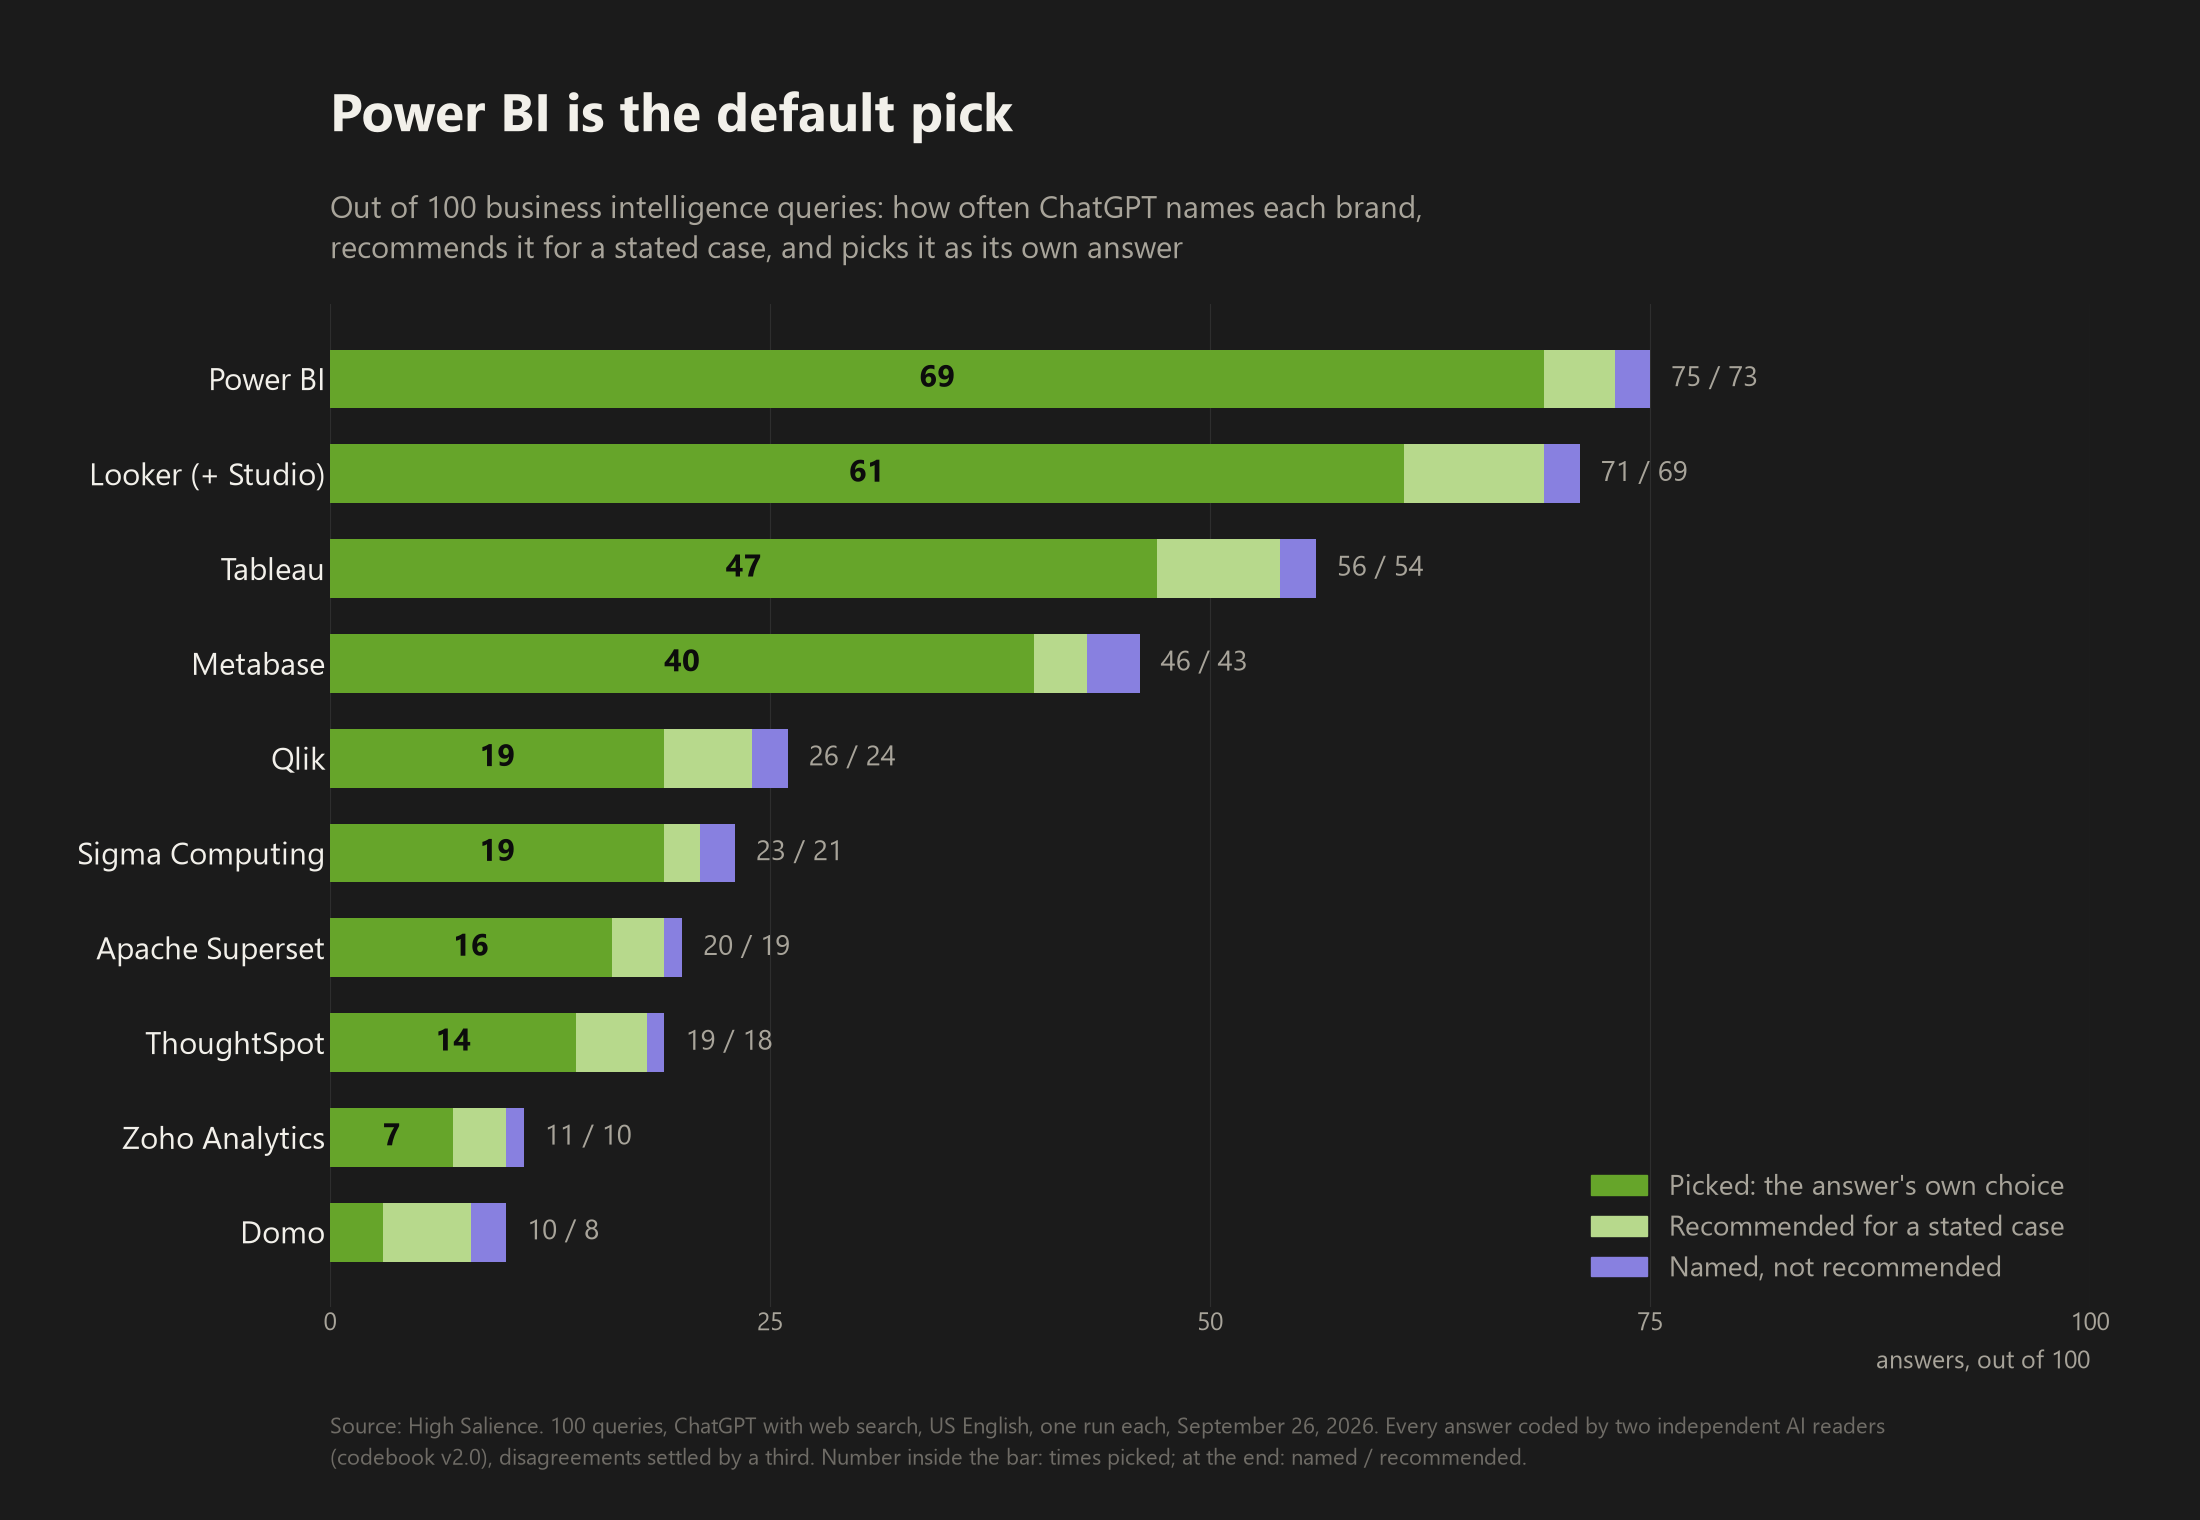
| Brand | Appears in | Recommended in | Picked in | Picked share of appearances |
|---|---|---|---|---|
| Power BI | 75 | 73 | 69 | 92% |
| Looker | 71 | 69 | 61 | 86% |
| Tableau | 56 | 54 | 47 | 84% |
| Metabase | 46 | 43 | 40 | 87% |
| Qlik | 26 | 24 | 19 | 73% |
| Sigma Computing | 23 | 21 | 19 | 83% |
| Apache Superset | 20 | 19 | 16 | 80% |
| ThoughtSpot | 19 | 18 | 14 | 74% |
| Zoho Analytics | 11 | 10 | 7 | 64% |
| Domo | 10 | 8 | 3 | 30% |
Each linked brand has its own page: how ChatGPT recommends every brand in this dataset, with positioning labels, head-to-head results and sources.
Out of 100 answers, codebook v2.0. "Picked" means the answer itself chose the brand as its verdict, overall or for a case. "Recommended" means the answer assigned the brand to a stated case or fit, and includes picked brands. "Appears" adds brands named as an option with no fit. The brand being replaced in an "alternatives" query is excluded from all columns.
Power BI is the default, and the stack decides the rest
Power BI is named in 75 of 100 answers, recommended in 73 and picked in 69. It is named in 29 of the 30 category answers and picked in 28; the exception is the open source question, where it appears only as the product an open source tool would replace. It is the first brand named in 45 answers. All 20 direct advice questions produced a pick: Power BI in 17, Looker in 15, Tableau in 11 and Metabase in 10. Head-to-heads were decisive: 29 of 30 picked every brand named, and the one that did not, ThoughtSpot versus Tableau, only offered to compare them. What sorts the picks is the buyer's stack. Excel is named in 65 answers, in 48 of them in the same sentence or line as Power BI. The question about Microsoft 365 picks Power BI alone; the questions about Google Workspace and BigQuery pick Looker alone. Power BI's four recommendations that are not picks are all the "if you already use Microsoft" line in answers about Snowflake, BigQuery, Google Workspace and a cheaper Looker. Tableau is described without being picked in 7 answers, 6 of them as the tool for polished or advanced visuals.
Second place is two products
Looker is named in 71 answers, recommended in 69 and picked in 61, but that count folds together Google's enterprise Looker and its free dashboard tool, Looker Studio. Counted from the answer text, 25 of the 71 answers name only Looker Studio, 32 name only Looker and 14 name both; of the 61 picks, 22 are in answers naming only Looker Studio, 26 only Looker and 13 both. Split apart, neither product would be second: enterprise Looker is named in at most 46 answers and picked in at most 39, Looker Studio at most 39 and 35, both below Tableau's 56 and 47. Looker Studio is the pick for free, cheap, easy and marketing dashboard questions; Looker is the pick for enterprise, embedded, finance and Snowflake questions. Google renamed Looker Studio back to Data Studio in April 2026; four answers mention the change, and all four still use the Looker Studio name.
Metabase owns the alternatives
Metabase is picked in 15 of the 20 "alternative to" questions, more than any other brand, and named in 18. Its site is part of the reason: metabase.com is cited in 23 answers, 18 of them to questions that never mention Metabase, across 13 different pages, many of them comparison pages, and Metabase is picked in 17 of those 18. In the answer to "simpler alternative to Tableau", Metabase's comparison pages were also the sources cited for the lines about Looker Studio, Power BI and Superset. The alternative questions are also where the answers most often stop short of a verdict: 4 of the 5 answers with no pick are alternative questions, including one that only asks the buyer what kind of Sisense alternative they want.
Industries get the generalists
Seventeen questions named an industry or a team, and all 17 produced a pick. Power BI was picked in 16 of them, Looker in 12 and Tableau in 9. Specialists were picked in three: ecommerce, where Triple Whale was picked in both questions; marketing agencies, where AgencyAnalytics and Databox were picked in both; and one of the two SaaS startup questions, which picked the product analytics tools Amplitude and Mixpanel. Healthcare, hospital, manufacturing, higher education, nonprofit, retail and finance answers picked no industry-specific BI vendor. Qlik gets 5 of its 19 picks in the healthcare, hospital, manufacturing and higher education questions.
The vendor Google ranks most is chosen only when named
domo.com is in Google's top ten for 43 of the 100 questions, 42 of its 45 results being articles from its Learn section, and in the first three results for 23. No other vendor's site ranks for more than 10. ChatGPT named Domo in 10 answers, recommended it in 8 and picked it in 3, all three head-to-heads that named Domo. In the 96 questions that do not name it, Domo was recommended 5 times, each a row in a table of options with a fit label such as executive reporting, and picked in none; domo.com was cited in 3 answers. Across the category, 292 of the 336 picks, 87 percent, went to brands whose own website did not rank in Google's top ten for the question, and 355 of 401 recommendations, 89 percent. Both are the highest shares in the series so far.
The vendors write the reading list
Across 100 answers there were 274 citation events to 78 domains. Vendors' own sites took 190 of them, 69 percent, level with password managers as the highest share so far, and 60 answers cited nothing but vendor pages. microsoft.com alone is cited in 51 answers, 35 of them to questions that never mention Power BI. Review and media sites supplied 4 citations, 1 percent, the lowest in the series so far. The most-cited independent sources are small publishers, dupple.com (6 answers), findanomaly.ai (5) and dataarchitect.co (4), and none of the eight most-cited third-party sites ranked in Google's top ten for any question where it was cited. Reddit sat in Google's top ten for 85 of the 100 questions and was cited in none; Reddit and Wikipedia have zero citations, for the twelfth teardown running.
Forty-four of the 274 citation events involved a domain that also sat in Google's top ten for that query, 16 percent, the lowest overlap in the series so far.
0312 categories, side by side
Same rulebook, every category so far.
| Measure (codebook v2.0) | Project management, Sept 8 | CRM, Sept 17 | Email marketing, Sept 17 | Help desk, Sept 17 | Accounting, Sept 17 | Payment processing, Sept 17 | Payroll, Sept 21 | HR software, Sept 26 | Applicant tracking, Sept 26 | Password managers, Sept 26 | Endpoint security, Sept 26 | Business intelligence, Sept 26 |
|---|---|---|---|---|---|---|---|---|---|---|---|---|
| Recommendations per category answer (average) | 5.9 | 4.3 | 5.0 | 5.5 | 4.3 | 4.2 | 4.6 | 5.0 | 4.5 | 3.4 | 4.7 | 5.0 |
| Answers with no recommended dictionary brand | 1 of 100 | 5 of 100 | 1 of 100 | 1 of 100 | 0 of 100 | 5 of 100 | 1 of 100 | 6 of 100 | 5 of 100 | 3 of 100 | 3 of 100 | 3 of 100 |
| Answers with no pick (the answer's own verdict) | 2 of 100 | 11 of 100 | 2 of 100 | 4 of 100 | 9 of 100 | 22 of 100 | 19 of 100 | 17 of 100 | 12 of 100 | 7 of 100 | 7 of 100 | 5 of 100 |
| Most-recommended brand: appears / recommended | Asana 73 / 73 | HubSpot 75 / 74 | Mailchimp 58 / 56 | Zendesk 70 / 69 | QuickBooks 75 / 73 | Stripe 70 / 68 | Gusto 73 / 73 | Rippling 58 / 57 | Workable 53 / 52 | Bitwarden 84 / 82 | Microsoft Defender 68 / 67 | Power BI 75 / 73 |
| Most-picked brand: appears / picked | Asana 73 / 70 | HubSpot 75 / 69 | Mailchimp 58 / 44 | Zendesk 70 / 61 | QuickBooks 75 / 65 | Stripe 70 / 54 | Gusto 73 / 61 | Rippling 58 / 50 | Workable 53 / 47 | Bitwarden 84 / 78 | Microsoft Defender 68 / 62 | Power BI 75 / 69 |
| Head-to-head queries recommending every named brand | 30 of 30 | 28 of 30 | 30 of 30 | 29 of 30 | 26 of 30 | 28 of 30 | 30 of 30 | 28 of 30 | 29 of 30 | 28 of 30 | 30 of 30 | 29 of 30 |
| Head-to-head queries picking every named brand | 30 of 30 | 23 of 30 | 29 of 30 | 29 of 30 | 25 of 30 | 19 of 30 | 21 of 30 | 21 of 30 | 29 of 30 | 27 of 30 | 29 of 30 | 29 of 30 |
| Recommendation-intent queries with a dictionary recommendation | 19 of 20 | 18 of 20 | 20 of 20 | 20 of 20 | 20 of 20 | 19 of 20 | 20 of 20 | 18 of 20 | 20 of 20 | 19 of 20 | 19 of 20 | 20 of 20 |
| Recommendation-intent queries with a pick | 19 of 20 | 18 of 20 | 20 of 20 | 20 of 20 | 19 of 20 | 18 of 20 | 20 of 20 | 18 of 20 | 20 of 20 | 19 of 20 | 19 of 20 | 20 of 20 |
| Recommended mentions where the brand does not rank in Google's top 10 | 398 of 468 (85%) | 269 of 387 (70%) | 313 of 419 (75%) | 350 of 445 (79%) | 206 of 368 (56%) | 294 of 360 (82%) | 202 of 383 (53%) | 310 of 405 (77%) | 333 of 388 (86%) | 218 of 304 (72%) | 273 of 369 (74%) | 355 of 401 (89%) |
| Picked mentions where the brand does not rank in Google's top 10 | 349 of 416 (84%) | 226 of 330 (68%) | 270 of 370 (73%) | 291 of 380 (77%) | 141 of 279 (51%) | 170 of 222 (77%) | 113 of 246 (46%) | 232 of 311 (75%) | 261 of 311 (84%) | 163 of 241 (68%) | 231 of 319 (72%) | 292 of 336 (87%) |
| Google top 10 that is third-party pages | 746 of 1,000 (75%) | 710 of 1,000 (71%) | 720 of 1,000 (72%) | 714 of 1,000 (71%) | 743 of 1,000 (74%) | 787 of 1,000 (79%) | 653 of 1,000 (65%) | 820 of 1,000 (82%) | 871 of 1,000 (87%) | 866 of 1,000 (87%) | 778 of 1,000 (78%) | 823 of 999 (82%) |
| Citation events to vendors' own sites | 216 of 362 (60%) | 136 of 320 (42%) | 193 of 367 (53%) | 152 of 345 (44%) | 125 of 302 (41%) | 161 of 301 (53%) | 192 of 314 (61%) | 167 of 325 (51%) | 139 of 311 (45%) | 201 of 292 (69%) | 149 of 266 (56%) | 190 of 274 (69%) |
| Answers citing only vendor pages | 50 of 100 | 40 of 100 | 37 of 100 | 27 of 100 | 34 of 100 | 47 of 100 | 49 of 100 | 34 of 100 | 30 of 100 | 65 of 100 | 44 of 100 | 60 of 100 |
| Share of citations in the 10 most-cited domains | 54% | 40% | 42% | 45% | 55% | 58% | 55% | 46% | 44% | 72% | 58% | 62% |
| Citation events whose domain is in Google's top 10 | 83 of 362 (23%) | 83 of 320 (26%) | 97 of 367 (26%) | 80 of 345 (23%) | 99 of 302 (33%) | 98 of 301 (33%) | 134 of 314 (43%) | 85 of 325 (26%) | 59 of 311 (19%) | 78 of 292 (27%) | 72 of 266 (27%) | 44 of 274 (16%) |
| Reddit and Wikipedia citations | 0 | 0 | 0 | 0 | 0 | 0 | 0 | 0 | 0 | 0 | 0 | 0 |
All columns are coded under codebook v2.0 by two independent AI readers per answer; the project management column is the September 8 dataset recoded under it. Each teardown is one run per query in its own window, so differences between columns mix category with collection date.
04What this changes
Four things, in order.
Ranking articles is not being chosen. Domo's Learn articles rank for 43 of these questions, and the model picked Domo in none of the questions that did not name it. An article that ranks for "best BI tools" puts your page in front of searchers, not your product in the verdict.
Comparison pages get read for other vendors' questions. metabase.com was cited in 18 answers to questions that do not mention Metabase, Metabase was picked in 17 of them, and in one answer its pages were the source for three competitors' lines. Clear, specific comparison pages are material the model uses.
Tie yourself to a stack in plain words. The answers sort this category by what the buyer already runs: Microsoft 365 and Excel to Power BI, Google Workspace and BigQuery to Looker, a cloud warehouse such as Snowflake to Sigma. A tool without a stated fit is more likely to be described than picked.
Specialists win only where the job is different. Triple Whale was picked in both ecommerce questions and AgencyAnalytics and Databox in both agency questions. Healthcare, manufacturing and education questions got no industry-specific vendor, so a vertical BI product has to make its case where the model can read it.
05Limitations
What this teardown cannot tell you.
One run per query means answer variance is unmeasured; Benchmark 01 runs each query three times across three surfaces. The teardowns are collected on different days, so differences between categories mix the category with the date. The brand dictionary covers the general business intelligence software market and deliberately excludes vertical tools, so their appearances are described in prose and not counted. The readers are AI models, not people: they follow a written protocol and agree with each other closely, but a shared blind spot would not show up as disagreement. The line between picked and recommended is a judgment, documented in the protocol with examples. Sentiment is not coded. No vendor-tool cross-check was read for this category. Google's control counts a brand as ranking only when its own domain is in the top ten; a listicle that features the brand does not count. One run per question, one day, United States, English, logged out. Answers vary between runs, so these are frequencies for this sample. The codes come from AI readers, not people; the line between a pick and a recommendation for a stated case is a judgment, and the two readers split on it 7 times in this category before a third reader decided. Looker's figures combine Looker and Looker Studio; the split above is counted from the answer text. Excel and Google Sheets are not in the dictionary, so an answer that suggests a spreadsheet is counted only for its BI picks.
06Dataset
Check it, don't believe it.
Every number above can be recomputed from these files. CC BY 4.0: use them, cite the page.
- queries.csv: the 100 queries with intent labels.
- brands.csv: the 45-brand dictionary with aliases and canonical domains.
- mentions.csv: 454 coded brand mentions with position, type, a 0/1 picked column and whether the brand's domain was in Google's top ten.
- citations.csv: 274 citation events with domain class and Google overlap.
- observations.csv: one row per query with brand, recommendation, citation and control counts.
- dictionary-changes.md: the two web-address additions made after collection, before the final coding run
- brands-original.csv: the dictionary as fixed before collection, before those additions
- coder-notes.md: how the answers were coded, reader agreement, the Looker and Looker Studio split, and the judgment calls that matter in this category
- codebook.md: the rulebook, with dated amendments through v2.0.
- reader-protocol.md: the written protocol both readers coded against (codebook v2.0).
- picked_stats.json: the picked-level figures.
The earlier teardowns: Teardown 01, project management, Teardown 02, crm, Teardown 03, email marketing, Teardown 04, help desk, Teardown 05, accounting, Teardown 06, payment processing, Teardown 07, payroll, Teardown 08, hr software, Teardown 09, applicant tracking, Teardown 10, password managers, Teardown 11, endpoint security.
Twelve categories, and the reading list is still the story.
In business intelligence the model's picks track what the vendors publish, their own product pages and one vendor's comparison library, while the vendor site Google ranks most is cited in 3 answers. Finding out what the model is reading for your category is the first thing a Category Salience Brief does, with a query set you approve first.